SQL Query Diagrams
A Visual Lexicon
Lexicon n. A stock of terms used in a particular profession, subject or style.
Introduction
"A picture is worth a thousand words" - Author unknown
Complex ideas are often perceived as less complex if they can be visualised. Whilst we have freely accepted the value in using highly symbolic methodogies for database design (NIAM and ER diagrams are examples) and program design (NS and SDC diagrams for example), seemingly little work has been done on SQL Query representation.
Information Processing and Technology (IPT) is one of many disciplines that use querying languages to extract pertinent data from relational databases. Students of IPT typically find elementary SQL queries trivial, and can easily arrive at complete solutions with little dificulty. Certainly, when comparing them to other language structures encountered in the IPT course, simple queries seem to require little cognitive ability.
The formation of complex data retrieval statements in SQL can prove problematic to even the most gifted of students, and this is compounded by the lack of a standard way to represent the planning of an answer.
Recent developments in QBE (Query by Example) have illustrated that even novices can compose relatively straightforward queries visually without needing to refer to, or even be aware of, the underlying SQL query syntax. QBE, unfortunately becomes clumsy to the point of being unusable for complex queries involving many tables and diverse conditions. Confident users of query languages such as SQL realise that half the battle when formulating complex queries is identifying where the data necessary for the solution is located.
This paper discusses and illustrates a diagrammatic method of query design that is sufficiently dialect independent to be useful to users of any flavour of SQL. This method, with minor refinements, has been used successfully with Year 11 and 12 IPT students for the past 8 years at St. Joseph's College, Gregory Terrace in Brisbane.
The symbol set used with these query diagrams has evolved, and continues to do so, but has been very successful in providing students with a physical model through which they can visualise complex data relationships, constraints and dependencies. Whilst this paper introduces conventions and symbology, they should not be seen as prescriptive - their purpose is to provide a conceptual framework for students, and so teachers are encouraged to use whatever symbols make sense to their students.
Throughout this paper, reference to TWO relational databases will be made. Both the MUSIC database and the FAMILY database are used extensively in coursework, and provide sufficient raw data to present non-trivial query experiences for students.
Introducing the MUSIC Database:
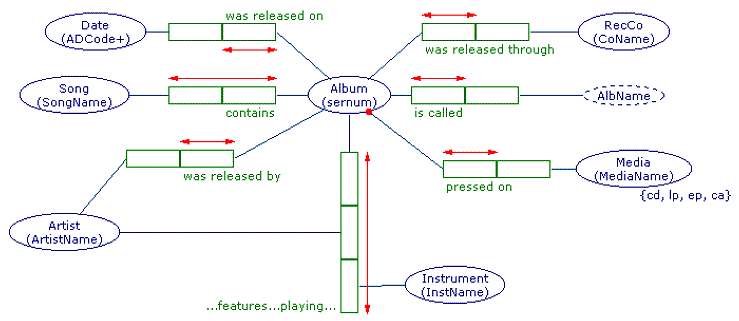
The MUSIC database is used throughout the Database Languages section of the Terrace IPT course. It is a simple collection of 3 related tables that summarises some of the music collection of the author. It's structure is illustrated below via a conceptual schema diagram:

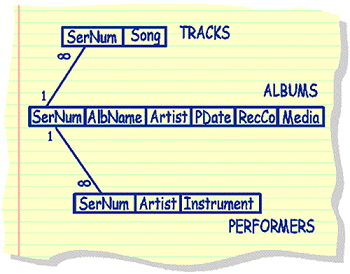
The corresponding relational schema is detailed below:
Table: ALBUMS
this table contains most general information about
each recording - SerNum is taken from the spine of the sleeve, AlbName
is the title of the album, Artist is either the name of the group (e.g..
"U2") or the name of the person who released the album (e.g..
"Presley, Elvis"), Media is how I bought it (CD, LP, CA),
PDate is the year it was published and RecCo is the company that released
this pressing.
| SerNum | AlbName | Artist | Media | PDate | RecCo |
| char(15) | char(25) | char(20) | char(2) | dec(4) | char(10) |
| NOT NULL | NOT NULL | ||||
| KEY |
|
Table:
TRACKS
|
Table:
PERFORMERS
|
SerNum is the foreign key linking all three tables, so:

Throughout this paper, 'neat' diagrams that computer generated are used. Students, however, are encouraged to do their diagrams as scribble sketches in pencil in their notebooks - most students can manage relatively straight lines freehand, and they often omit column names if they are not part of the query.
It is important to remember this symbol set is designed to be used by students in their planning (a sort of rough working if you like). I encourage students to include any diagrams they use with the actual answer, in an exam say, for possible allocation of part marks. I also use these diagrams to explain complex ideas without needing to descend to code level, and find students are able to read the diagrams in their minds-eye as SQL easily anyway. Students often prefer to record the diagram solution rather than the specific SQL query for future reference.
Conventions
In the diagrams that follow, tables (relations) are represented as blue rectangles. Filters, constraints and data streams are draw in red. Corresponding MicroSQL queries are presented alongside the diagrams.
Acknowledgements:
I gratefully acknowledge contributions from many students who forced me to find more effective ways of explaining complicated processes and other things when plain English fails. I also wish to thank Mr Lee Lafferty who supplied me with some valuable source material and got me interested in this whole subject in the first place.